This page is still being edited and reviewed.
This page awaits a complete revision once the next ELN release ships a new Converter frontend and admin interface. The description below reflects the current Converter GUI.
Overview of the Converter functions
The purpose of the Chemotion Converter (in short: ChemConverter) is to convert different file formats and types from integrated devices into a common, well-known data type, such as jcamp .jdx or .json. It can also extract columns for 2D data visualization and Metadata. Currently, the ChemConverter can handle most text-readable files like txt/csv/dta if they are properly structured, but developers can create their own readers if a rule is notable for the newly added file type.
Most of the time, the ChemConverter runs as a background process when the user or a measurement device uploads an analytic file to the ELN. The prerequisite is that an admin has created a suitable profile. There is also a standalone version of the converter, which users can find and install from GitHub.
Technical aspect
Technically, the converter is built on three layers, namely the reader, the admin GUI and, last but not least, the upload & processing. The creator of a reader mostly requires knowledge of (e.g. Python) coding, while the admin of the second layer has to know the measurement technique and device very well, because this layer decides which info the user will get and see at the end of the third layer. The last layer is a simple Webapp that executes the code, or an automated process during the file upload. How the files are converted is decided by specific rules that listen for predefined identifiers.
First layer: The reader
The reader is the part of the programming code responsible for importing and handling the given data format. It is the most powerful layer due to its flexibility (e.g. calculation of custom Metadata or special and complex column rules and calculations).
Source codes for the readers and examples can also be found on Github. There are readers for common file types and specific ones that inherit from the basic ones. The following list shows some (but not all) of the current readers available:
- ASCII (aka simple TXT)
- CSV
- NOVA (Specific reader for an instrument without Metadata, also an example for custom Metadata calculation)
- DTA
Second layer: The admin Profile creation GUI
The final rules for converting a data file into a standardized Bagit-it-zip-Container containing .jdx/.json files are determined by profiles. Which profile is responsible is determined via identifiers. As with the readers, almost everything the input file contains can be used as an identifier, as long as the sum of identifiers for one profile is unique. The most common identifiers are:
- The file extension (.txt, .csv, .dta, ...)
- The first human readable line(s) of the header
- The data column titles
Purpose of the Profile GUI vs. Reader coding
The aim of the profiles is to give admin users, who have little or no experience with Python coding, the ability to define rule sets for conversion. It's also possible to define different profiles using the same Reader but slightly different data files (e.g., if only one column varies or two columns are mixed).
Third layer: Upload, processing and output
The normal user will only see the upload GUI, shown in the picture as the standalone version (left) or inside the ELN (right).
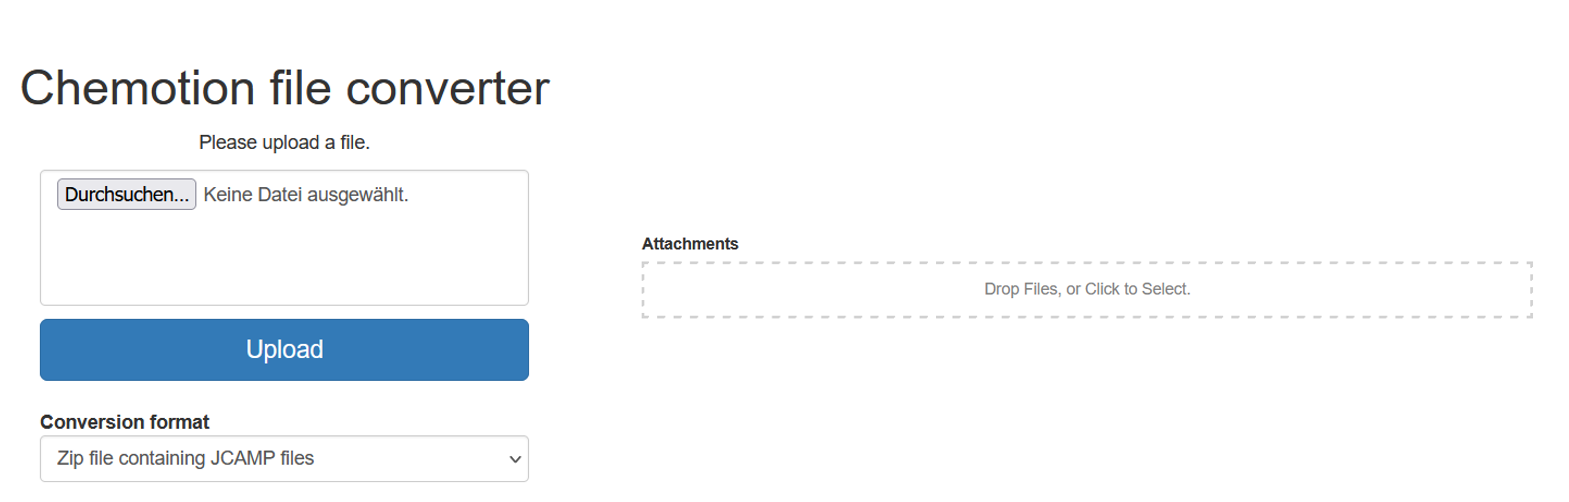
After the file is uploaded, it will be converted as long as a suitable reader and profile exist. It's possible (via deep coding) to define which file types are redirected to the converter and which ones are only displayed as they are (e.g. in the case of binary files like pictures) to avoid errors from the Converter app.
Managing Profiles
The following section is important for privileged users and admins to help them manage their own adjustments and profiles.
Find existing profiles
When using the standalone version, the user just enters the "converter-URL"/admin/ into the browser's address bar. When using the ELN-integrated version, the user has to be logged in as an admin and click on the "Converter Profiles" tab on the left side. In both cases, the following GUI appears, where all the profiles are listed (if there are already some, of course):
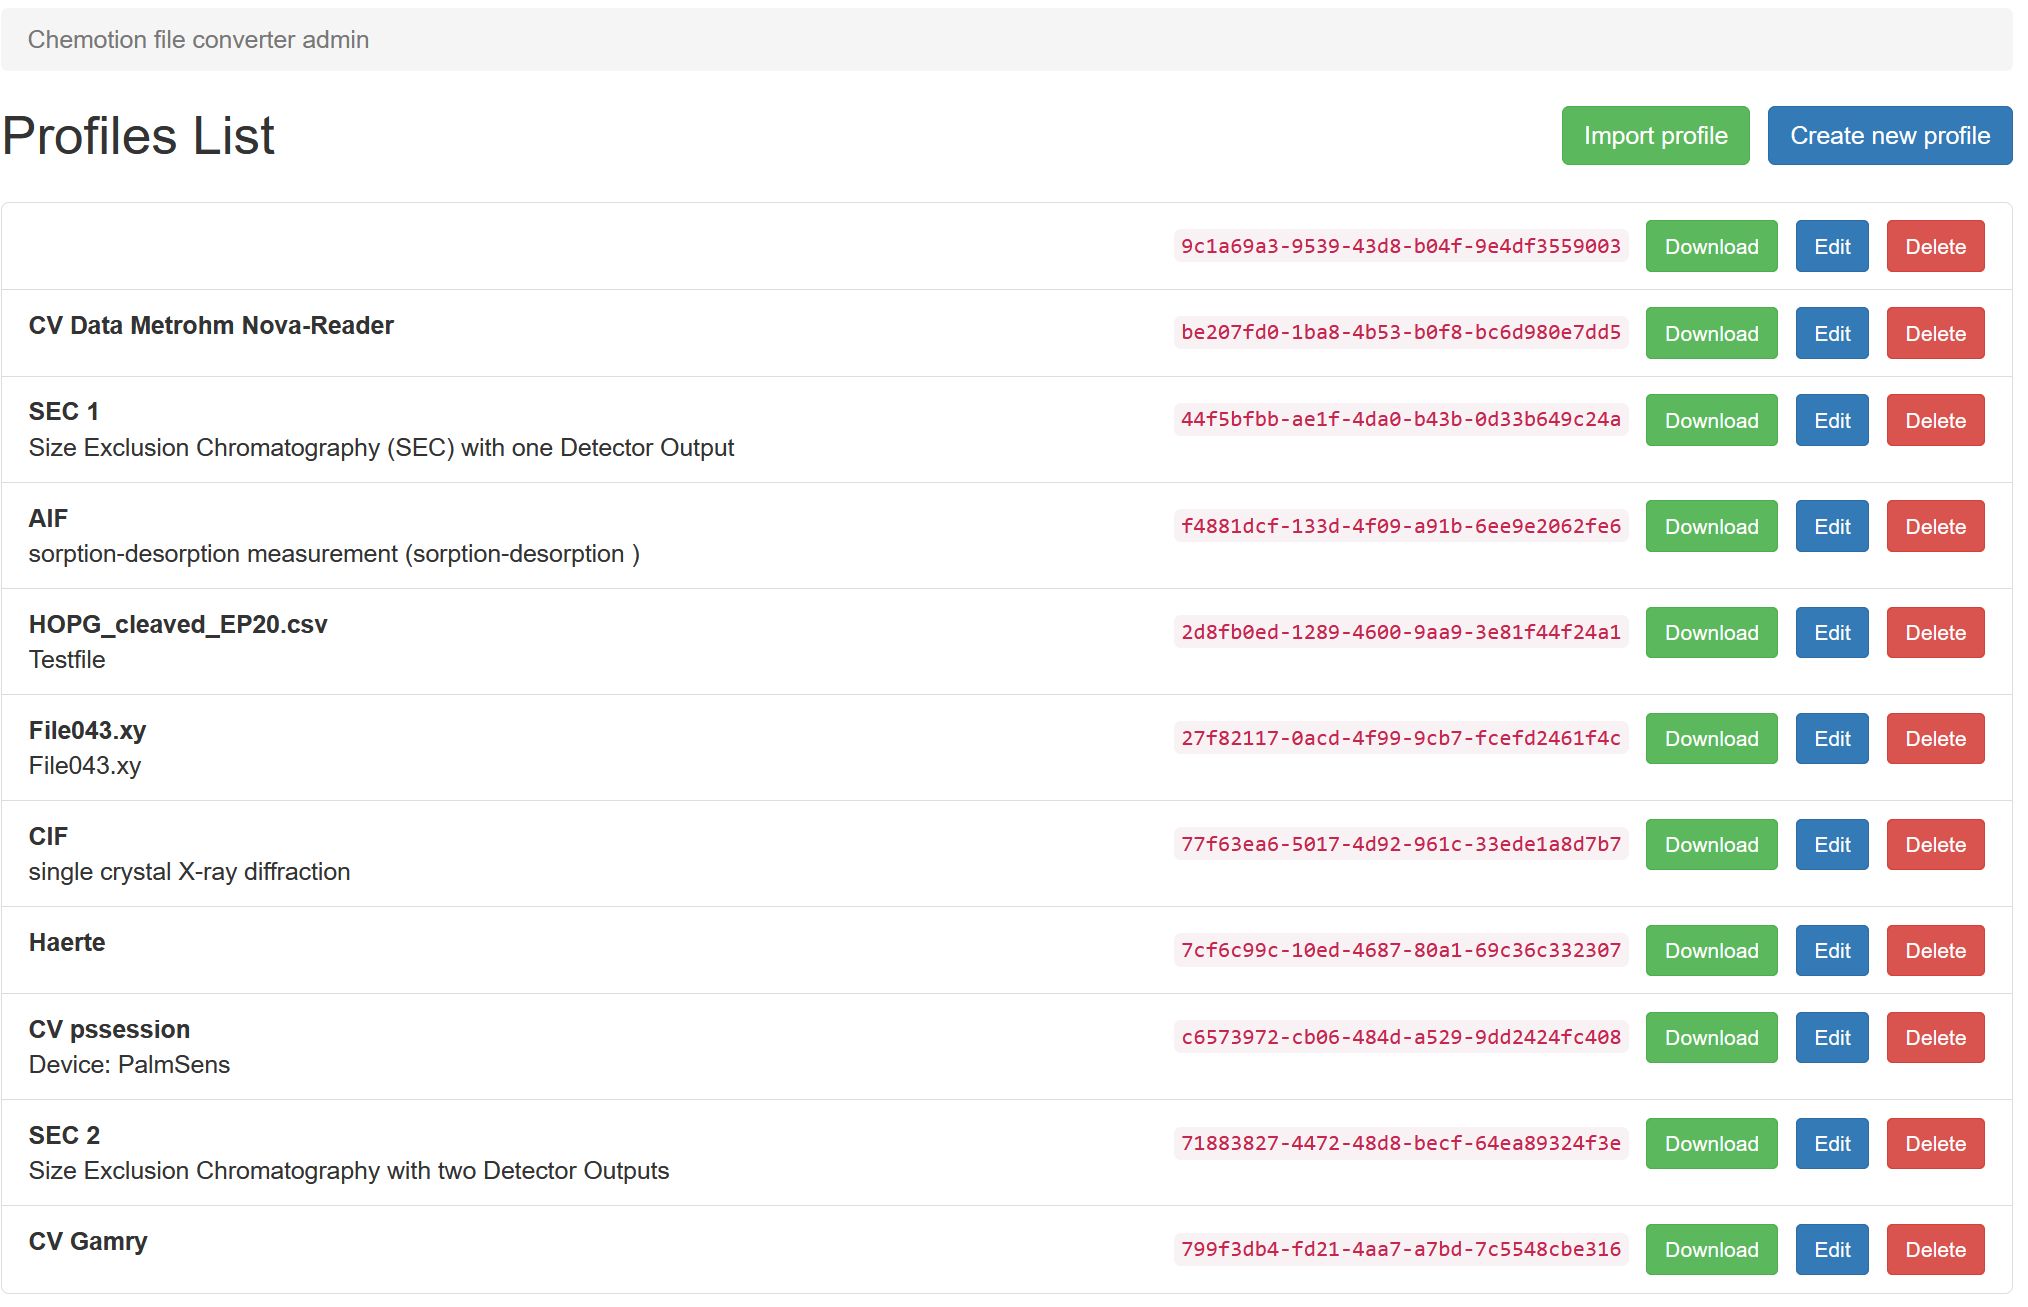
After clicking on the "Create new profile"-Button, the user can finally start to ...
Create your own profile
To create a profile, a first example file has to be uploaded. This file should be a maximal example with as much information as possible, even if later data files sometimes have less. The file type and its contents must fit an existing reader, or an error will occur. After the upload, the following default GUI will be shown:
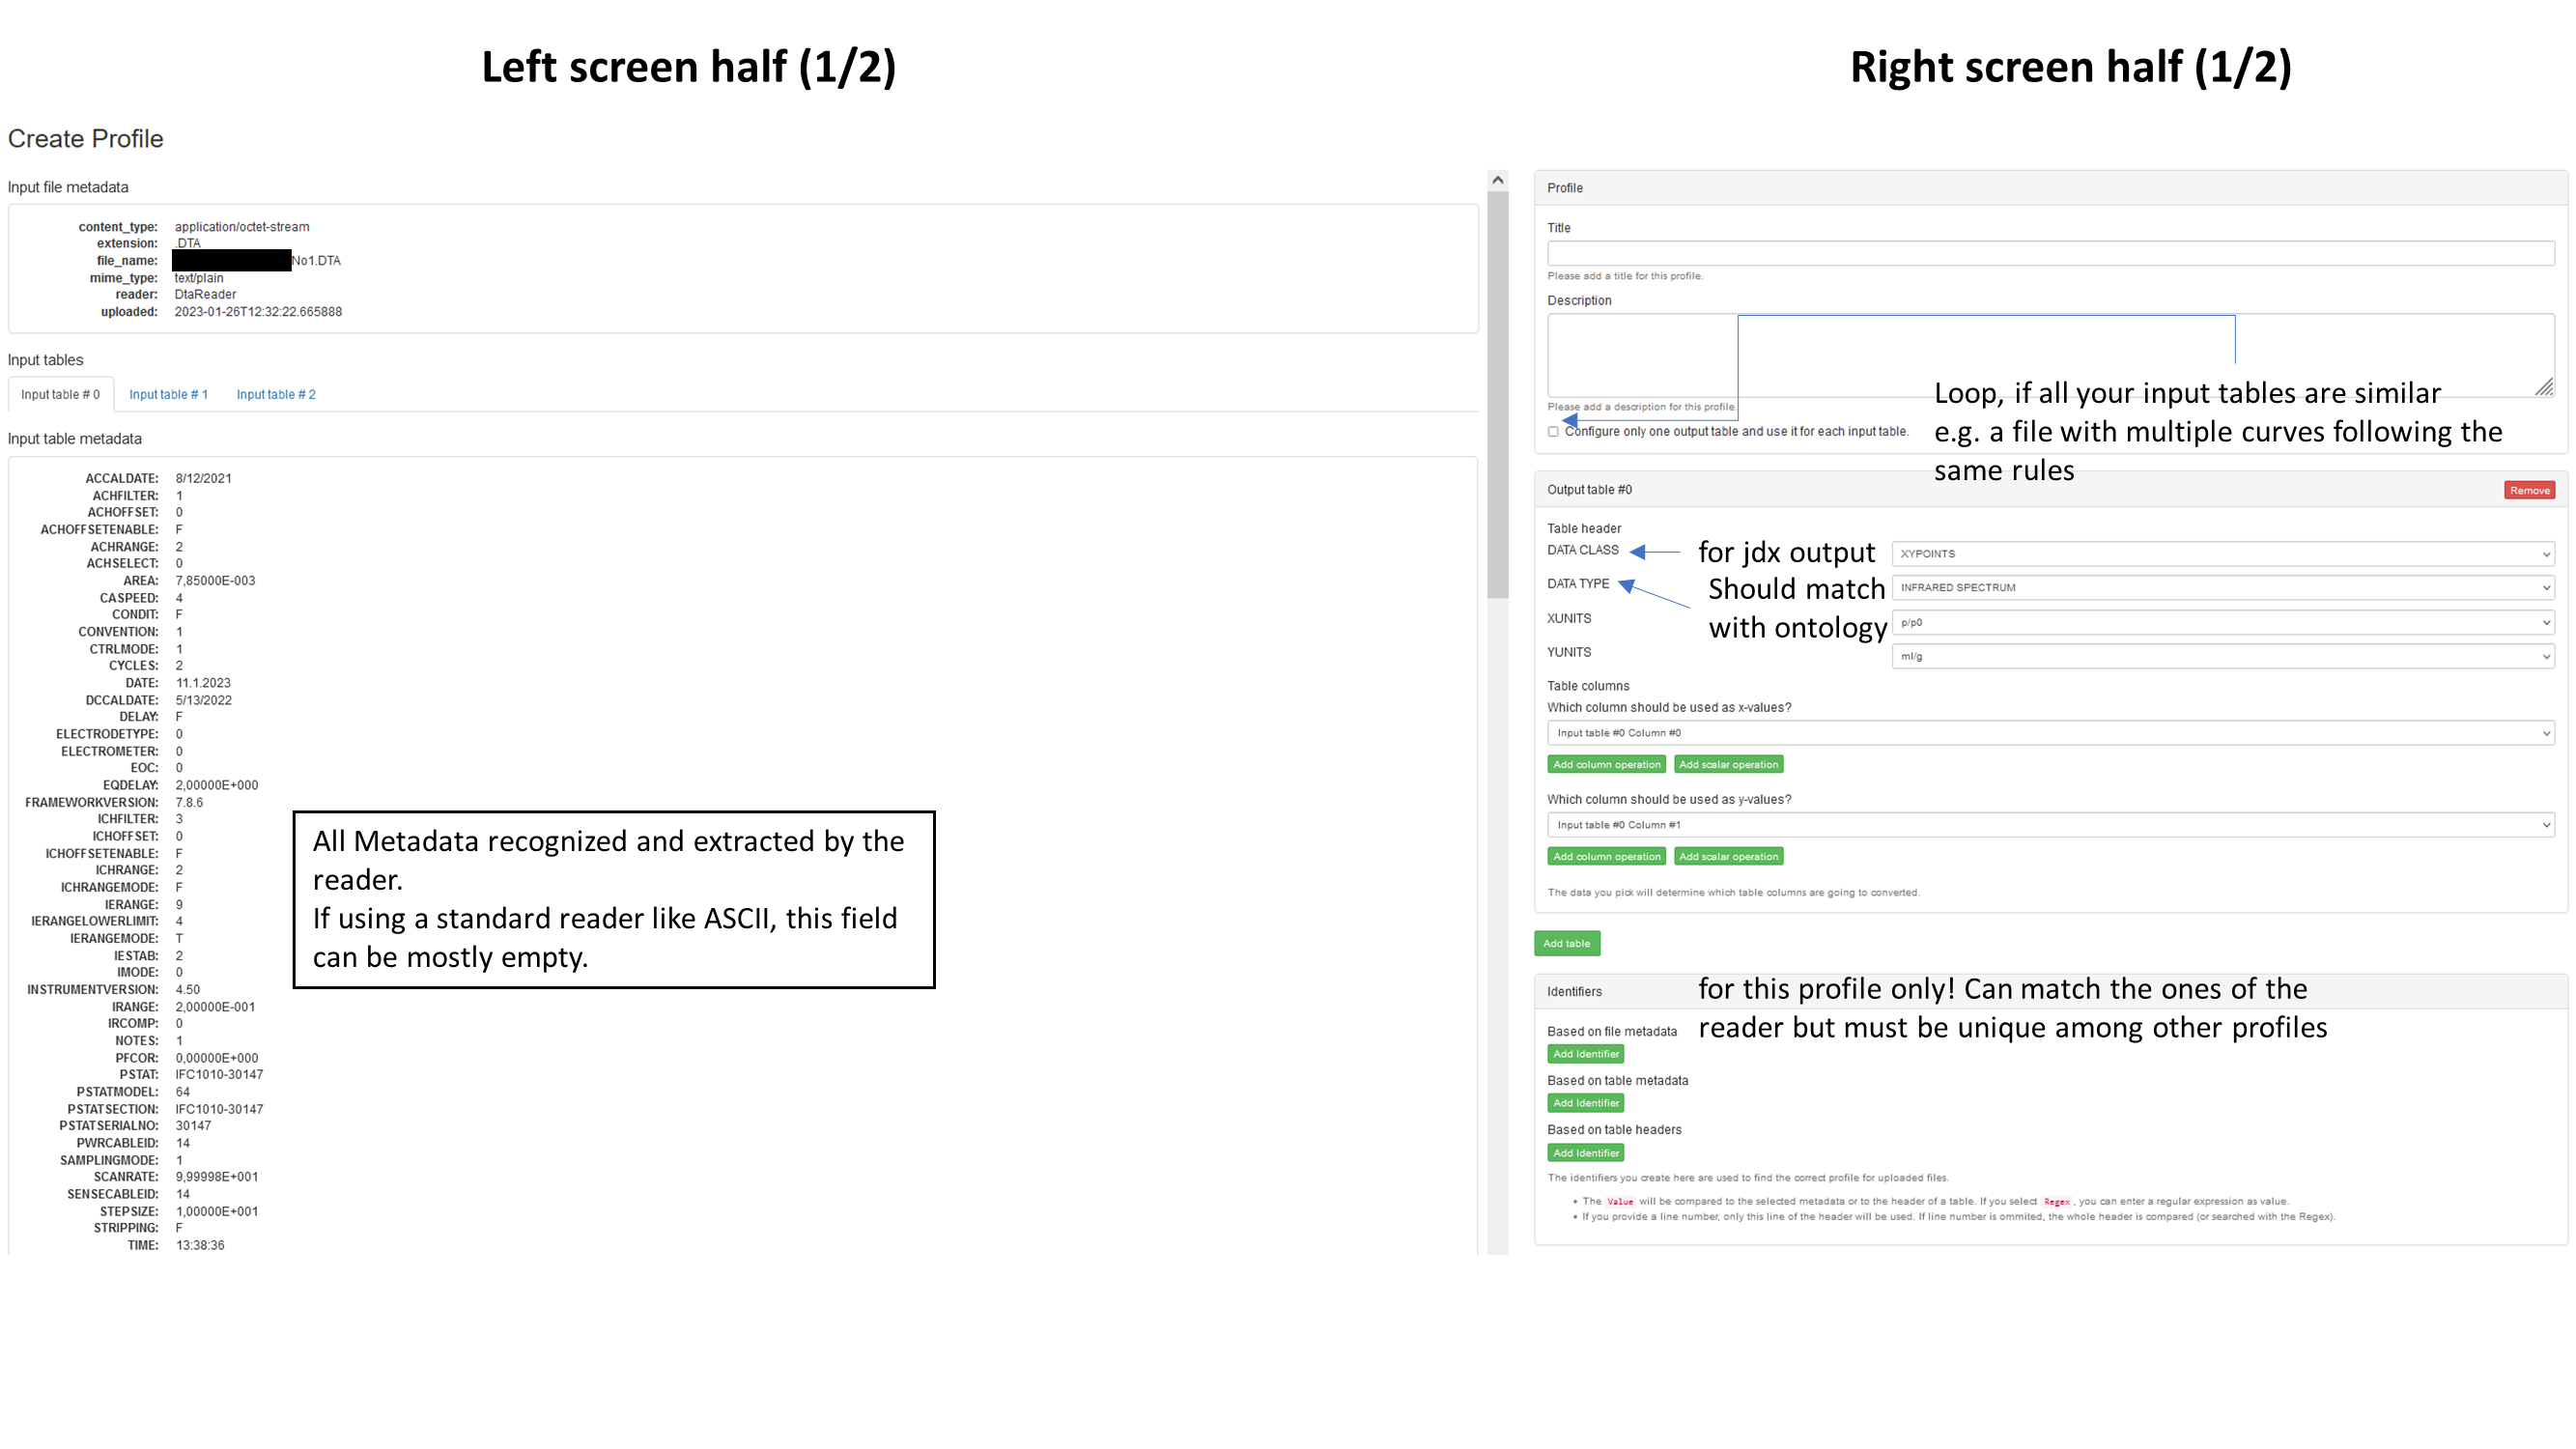
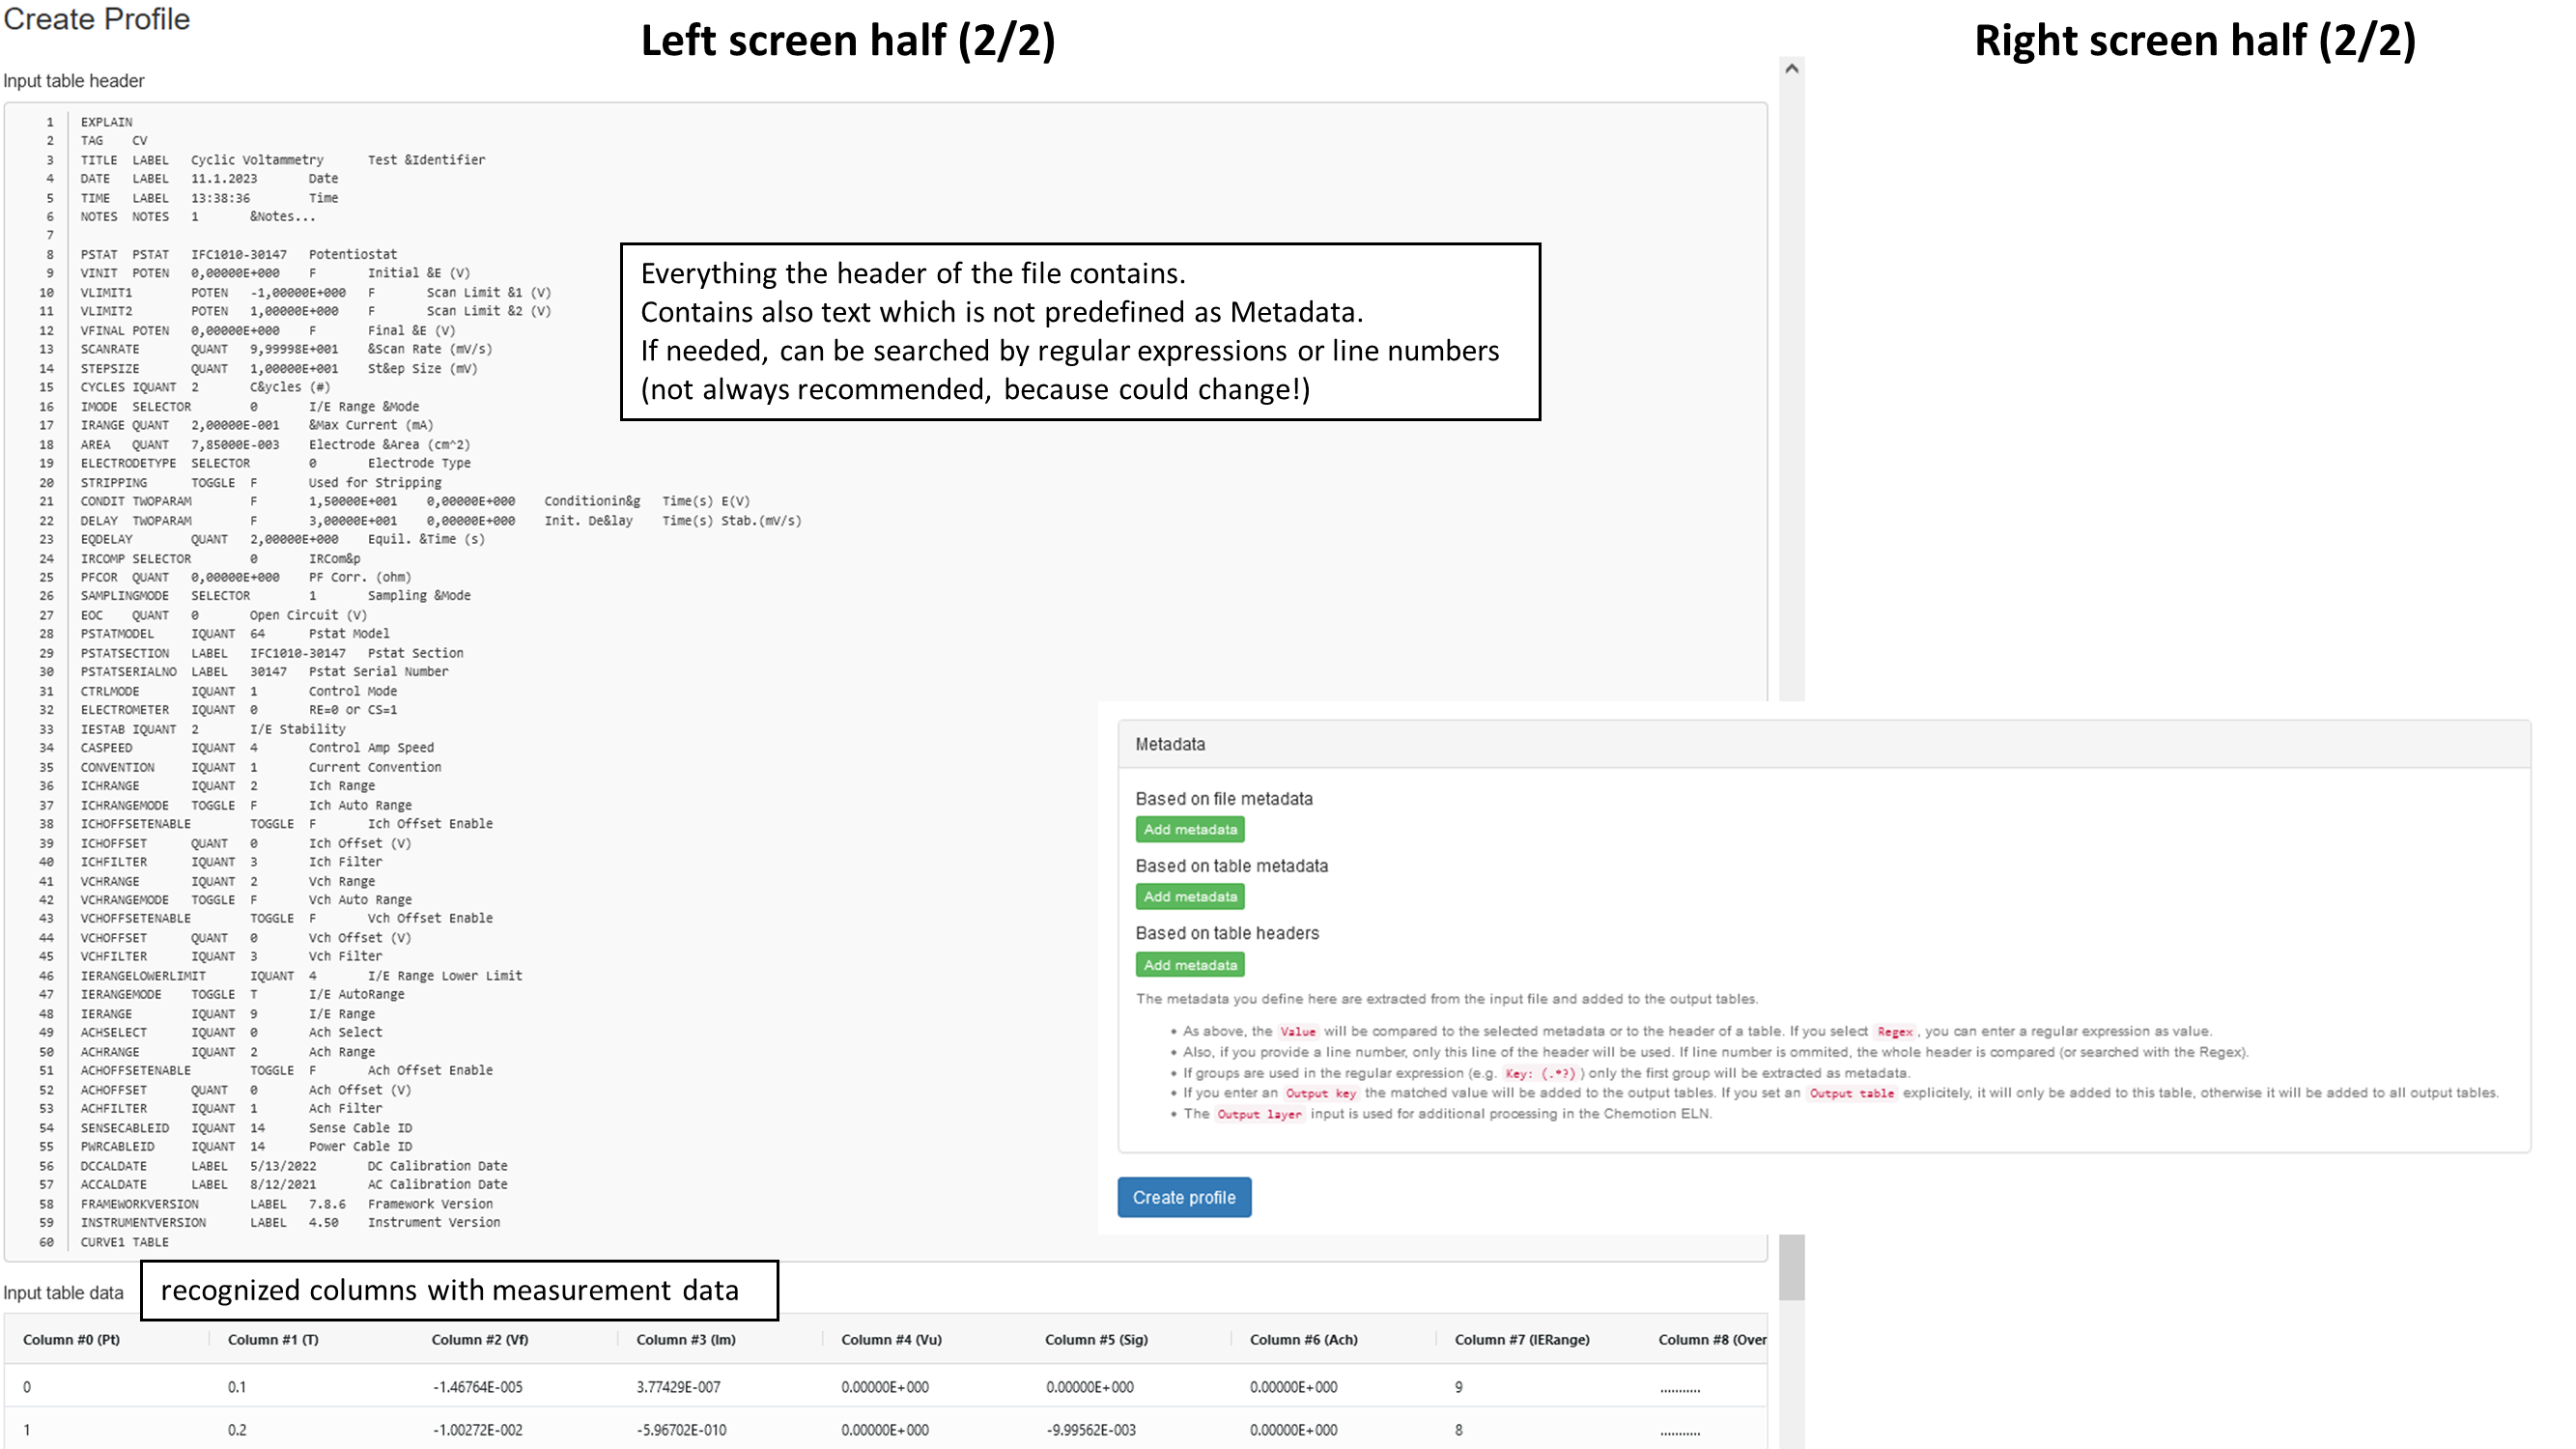
After all the adjustments and settings are done, the "Create profile" button will finish the job and the screen will be back to the existing profiles page. Now a non-admin user or an automatic process can upload and convert files.
Specific settings
Data Class
The "Data Class" drop down menu defines the kind of jdx output. Currently there are four used classes:
| Data Class | description | requirements |
|---|---|---|
| XY POINTS | typical "modern data curves" where each data point is described by two coordinates (x and y). Difference between each x need not be equal | exactly one column with x values & one column with y values |
| XY DATA | Classical jcamp files with the intention to save hard drive space. Difference between each x is always equal. | exactly one column with y values and defined values for FIRSTX, LASTX and DELTAX |
| PEAK TABLE | ||
| NTUBLES |
Data Type
A drop-down list of ontologies (mostly chemical analytic techniques) defining the kind of layout for displaying and plotting curves and spectra in ChemSpectra. Not all ontologies known in the ELN can be found here, because this is only for layout purposes. If something appears to be missing, users are welcome to tell the Chemotion team.
X & Y Units
A list of physical units containing the most common units with and without prefixes. If additional units are needed, please tell the Chemotion team or use the "scalar operation" feature to convert the column values.
Table columns
A drop-down menu for defining the x and y column values, while a preview can be seen at the bottom of the left side as "Input table data". Currently only 2D data extraction is possible, so if more is needed, the user can create additional Output tables and merge them together with external tools. Alternatively, the user can use the "column operation" feature to add, subtract, divide or multiply columns together.
In a future version it will become possible to create profiles without Output tables if the user intends to use the converter only for Metadata extraction.
Metadata and Identifiers
Both share some similarities, even in the backend (both are called "identifier" there), with the exception that Metadata have an assigned "optional = true" flag. Every piece of info and content the file provides that is not explicitly declared as (measurement) data by the reader can be seen as Metadata. Metadata can often be further broken into "key & value". Sometimes the key is provided together with the value, which makes it easier for the reader to recognize the string as Metadata, and in other cases, it has to be defined or assigned by a user with background and RegEx knowledge. While creating a profile, the user has to assign one of three match parameters to the desired key.
| Match | behavior | default for |
|---|---|---|
| Exact Value | The value of the key will only be extracted or valid for profile choosing if it's the same as the one of the example file during profile creation. | Identifiers |
| Any Value | The value will always be extracted as long as the key is found in the given file. | Metadata |
| RegEx | The value from the input field is translated into a regular expression and compared to the string value from the input file. If the RegEx is valid, the first group of the result will be extracted as the value for the wanted key. | n.a. but often used for searching table headers with/-out line number |
The extraction and assignment is now done by text fields and drop-down menus. The user just has to follow these steps:
- Press "Add Metadata/Identifier"
- Choose a key or table (+ optional line number) as input
- Choose one of three matches and if it is not "any", write a value or RegEx into the text field
- Choose an output layer (comparable with a category)
- Choose an output key
- Optional: add scalar Operators (+,-,*,:) to the calculation of the output
In the end, it could look like this:
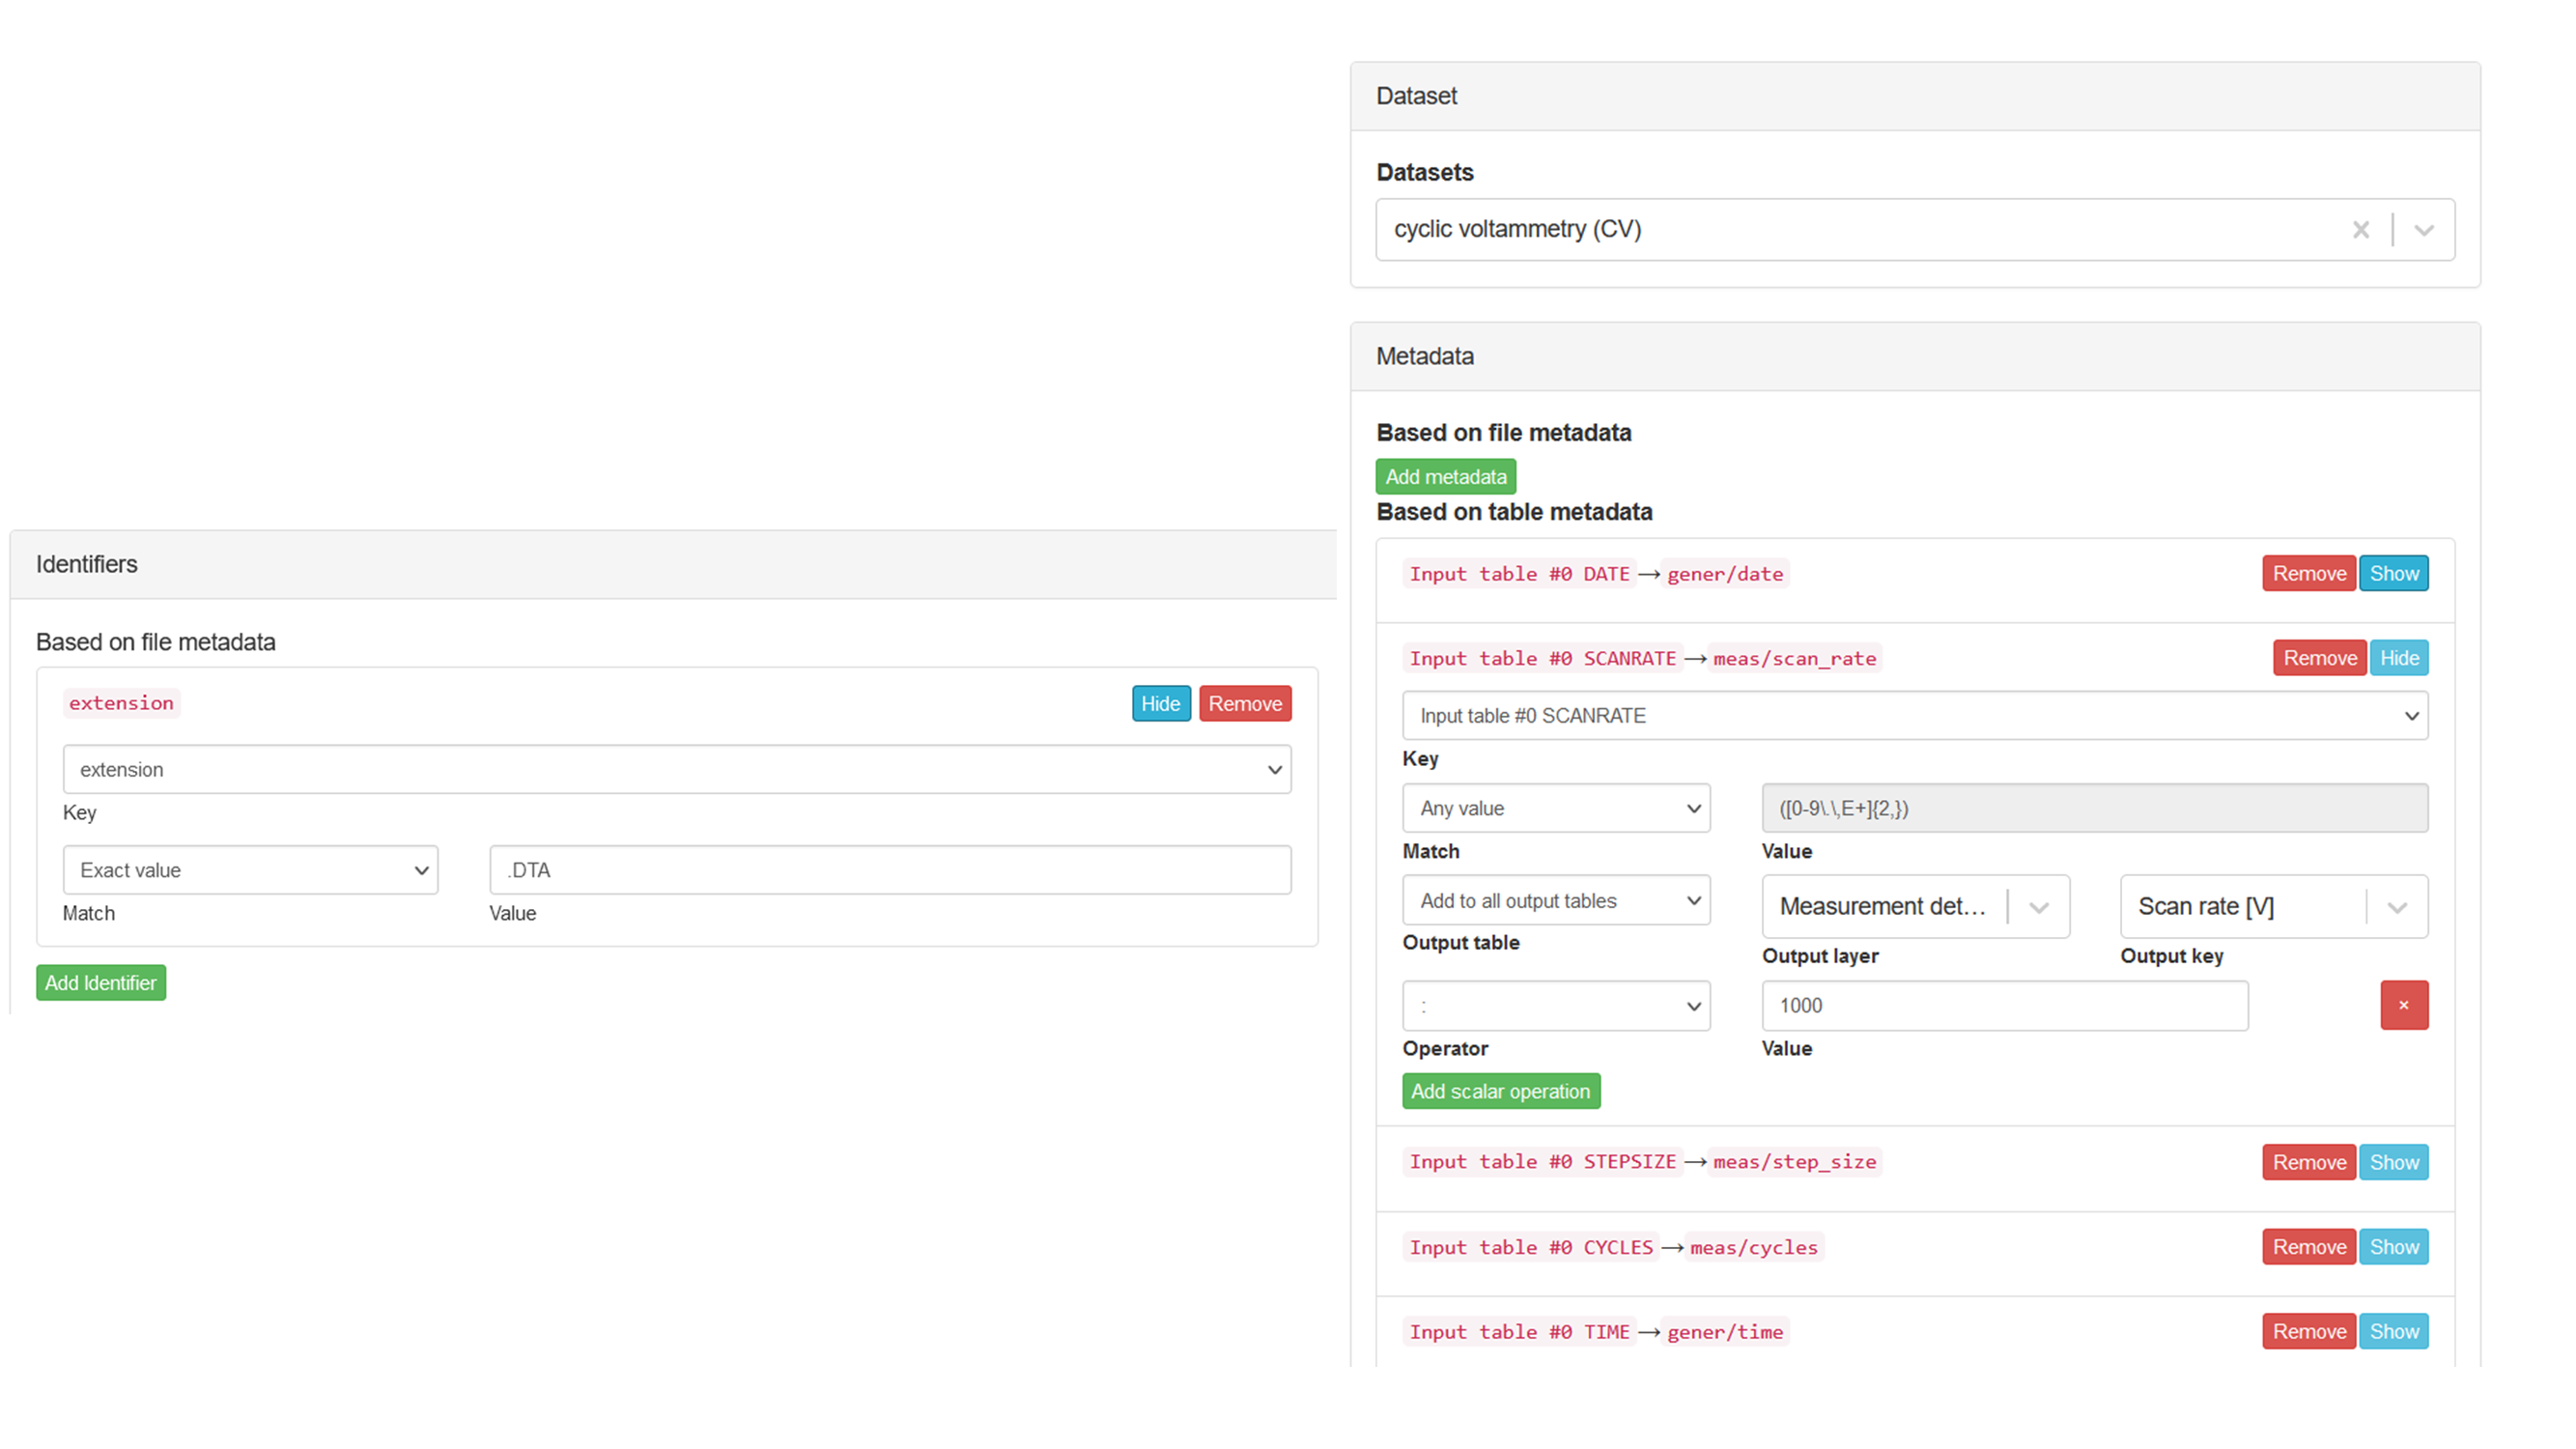
If the converter is integrated in the ELN and an already designed Dataset is chosen, bullet points 4 and 5 are chosen via drop-down menus; otherwise typing a value is necessary.
Save
To finish the creation or save changes, click on the "Create/Update profile" button or else everything will be lost.
Summary
The following picture shows the course of the three layers.
