Export & Save – Results from TLC Tool
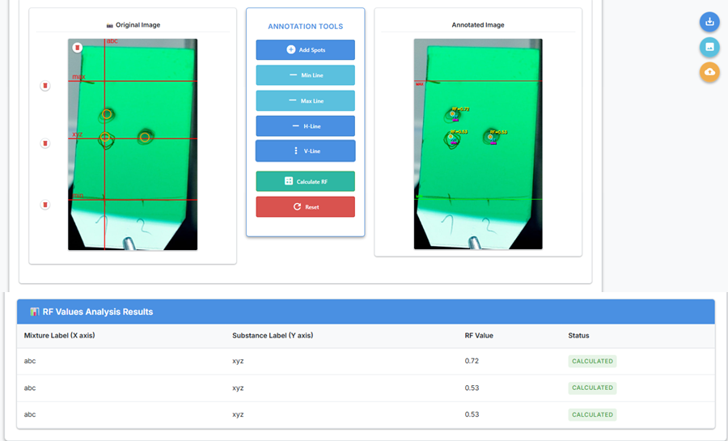
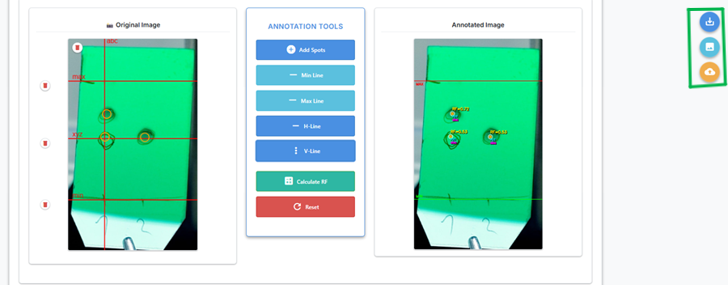
Once the user has annotated the TLC plate and calculated RF values, the tool offers three export options:
- Download CSV (Rf values)
- Download annotated image (PNG)
- Upload both (CSV and annotated image) to Chemotion (if the image was from Chemotion)
1. Download CSV
Click the Save CSV button to export the results table.
File Contents
- Mixture labels (X axis)
- Substance/Spot labels (Y axis)
- RF values (0–1 range)
Format
mixture_label (X axis),substance_label (Y axis),RF value
Sample A,Spot 1,0.72
Sample A,Spot 2,0.53
Extras
Includes inline summary notation for lab records:
TLC (solvents); Rf (UV-Vis in nm, staining) = 0.72 (Spot 1)[h1], 0.53 (Spot 2)[h2]
2. Download Annotated Image
Click the Save Image button to download a PNG with:
- All spots and lines drawn
- Labels visible
- Resized to match the original image resolution
📎 Filename includes timestamp for traceability.
3. Upload to Chemotion
If the image was originally loaded from Chemotion:
- Use the Upload to Chemotion button
- The tool sends both the annotated image and CSV to the original Chemotion URL
Requirements
-
Image Source Restriction Only images loaded from Chemotion support cloud upload. If the user uploads an image locally (i.e., not from Chemotion), the annotated image cannot be uploaded back to Chemotion.
-
CSRF Token A valid CSRF token must be available. This is handled internally by the system.