Usage Guide
This guide walks through each step of using the TLC Image Annotation Tool inside the Chemotion ELN.
Goal: Annotate TLC plate images and calculate Rf values easily
Step by Step
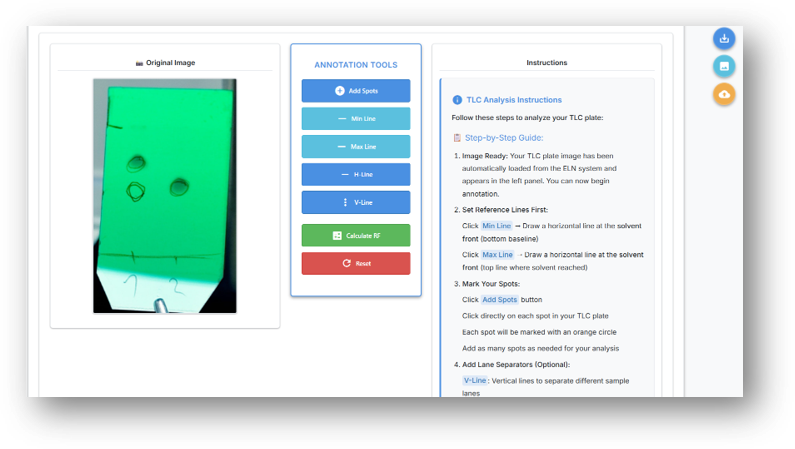
1️. Load a TLC Image
You can start in two ways:
- From ELN: Automatically fetch an image attached to a Chemotion ELN entry.
- Upload Local: Drag & drop or manually upload a file from your computer.
Only JPG or PNG images under 10MB are supported.
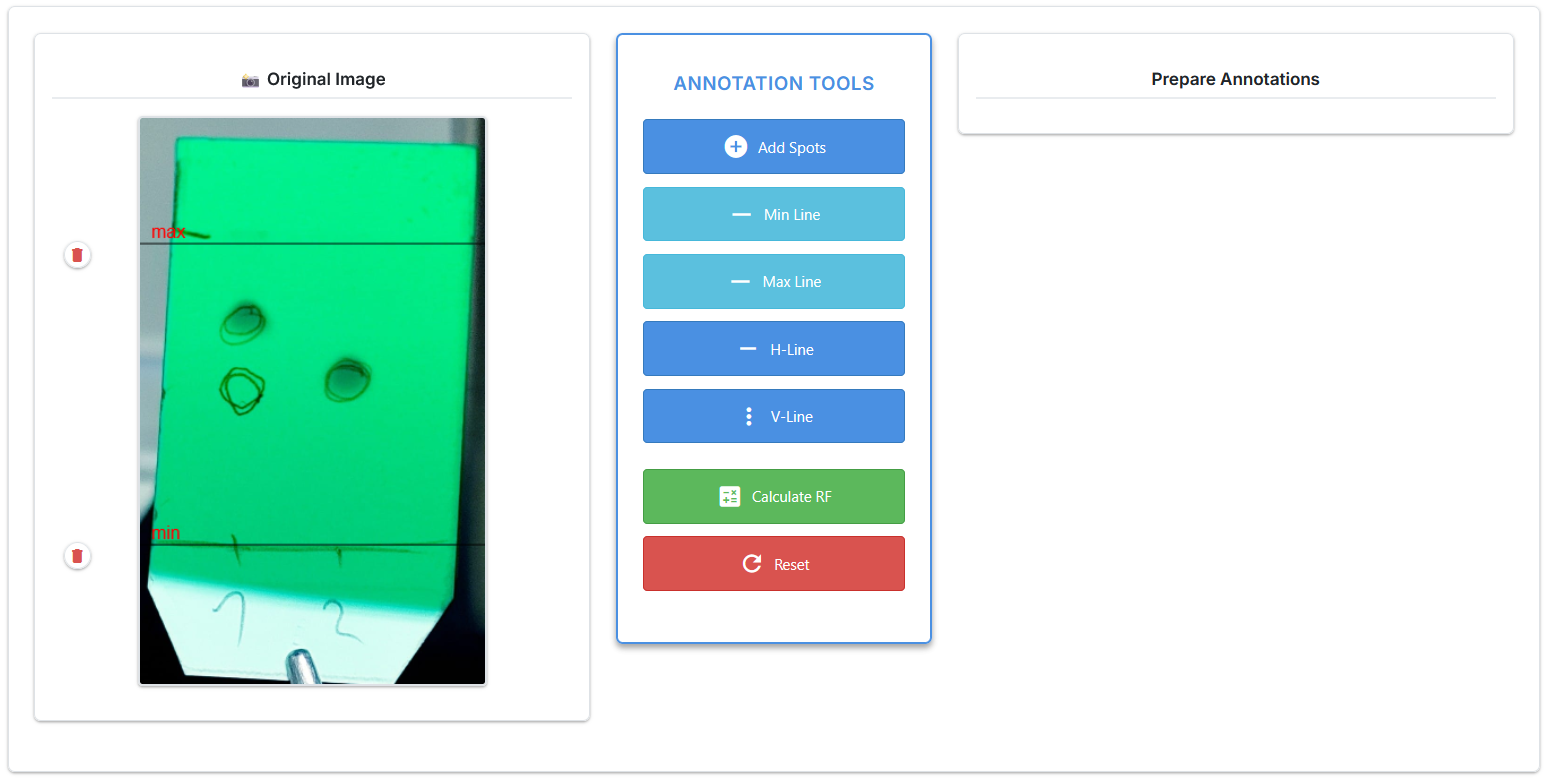
2️. Set Reference Lines
Before anything else, define the two key horizontal lines:
| Line Type | Description |
|---|---|
| Min Line | The baseline (sample spotting area) |
| Max Line | The solvent front (how far solvent traveled) |
Click the Min Line button, then click on the canvas. Repeat with Max Line.
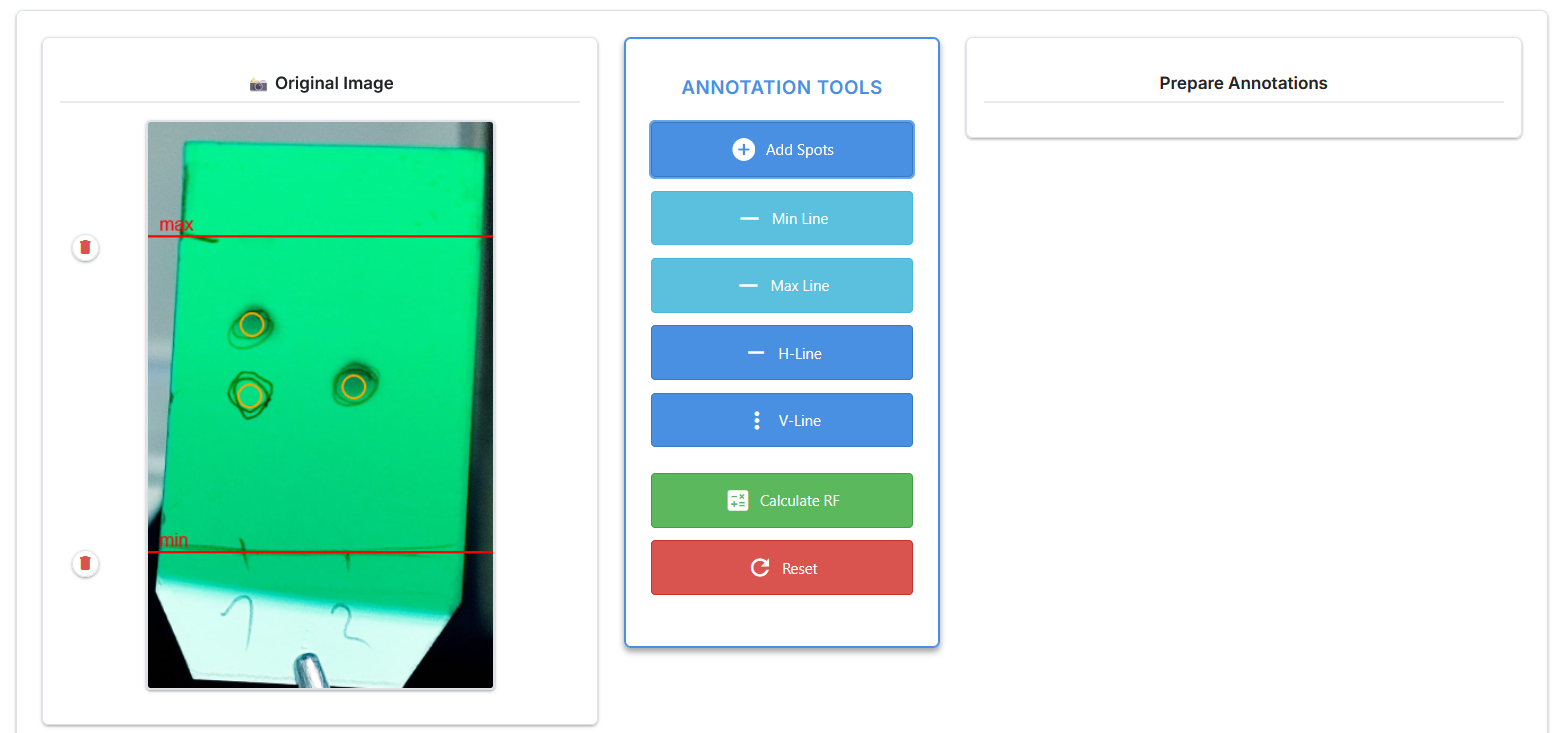
3️. Add Spots
Click Add Spots, then click once on each spot (visible compound) on the TLC plate.
- Each spot will be marked with an orange circle
- Click carefully near the center of the spot
- Drag to reposition if needed
- Double-click to delete
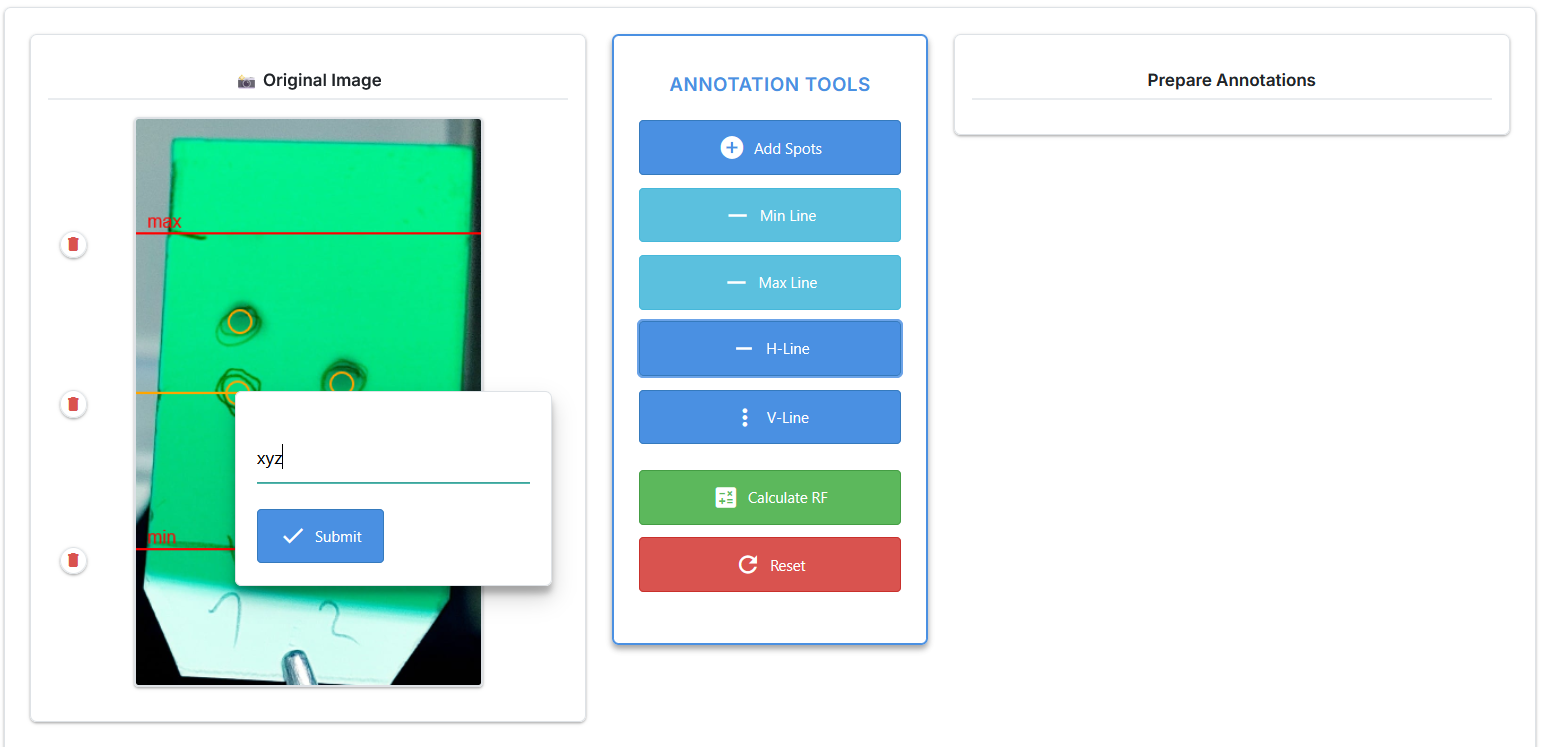
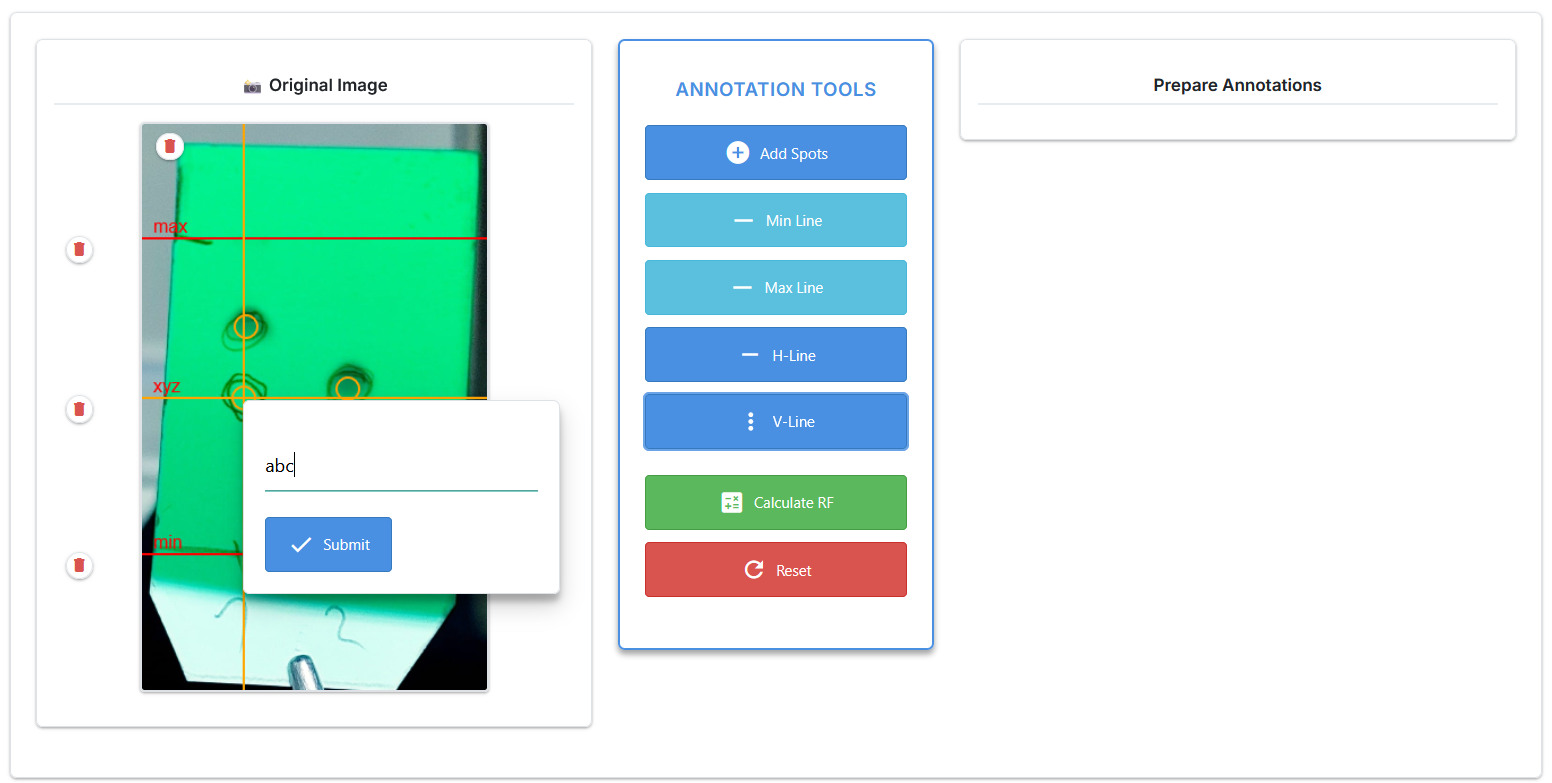
4️. Add Labels (Optional)
You can add reference lines and labels to structure the image:
- Vertical Lines (V-Line): Separate lanes (e.g., “Sample A”, “Standard”)
- Horizontal Lines (H-Line): Mark zones, standards, or notes
A popup will prompt for a label after placing each line.
5️. Calculate RF
Click the Calculate RF button.
The tool computes:
Rf = Distance from Min Line to Spot / Distance from Min to Max
6️. Export or Save
After calculation, you can:
- Download results as CSV
- Save the annotated image
- Push both to the ELN entry (if loaded from ELN)
Reset
Click the Reset button to:
- Clear all spots, lines, and table data
- Return to a clean canvas for a fresh start
Tips for Best Results
- Use high-resolution, well-lit TLC images
- Place Min/Max lines before marking spots
- Zoom in to be more precise
- Double-check RF values (should be 0 < RF < 1)