ChemSpectra
The Chemotion ELN supports the upload of many dataset formats. The file size restriction is set by the admin of the Chemotion ELN instance and can be adjusted to your needs. If open file formats are available, spectra viewers can visualize and edit the data set. At the moment, the Chemotion ELN supports ChemSpectra (described here) and NMRium as data viewer.
ChemSpectra is a web-based software for the visualization and analysis of spectroscopic data and allows the analysis of data attached to a sample or reaction in the Chemotion ELN. The focus of ChemSpectra is on analytical methods used in synthetic organic chemistry, such as infrared spectroscopy, mass spectrometry and NMR spectroscopy (one dimensional 1H and 13C). An in-depth description of ChemSpectra was published here.
The tool supports the open file formats JCAMP-DX (jdx) and mz(X)ML. Furthermore, it can support RAW and FID files. The user interface of ChemSpectra is identically for different analytical methods, while the tools are selected to fit the requirements of the different analytical methods. The user interface of ChemSpectra is shown here:
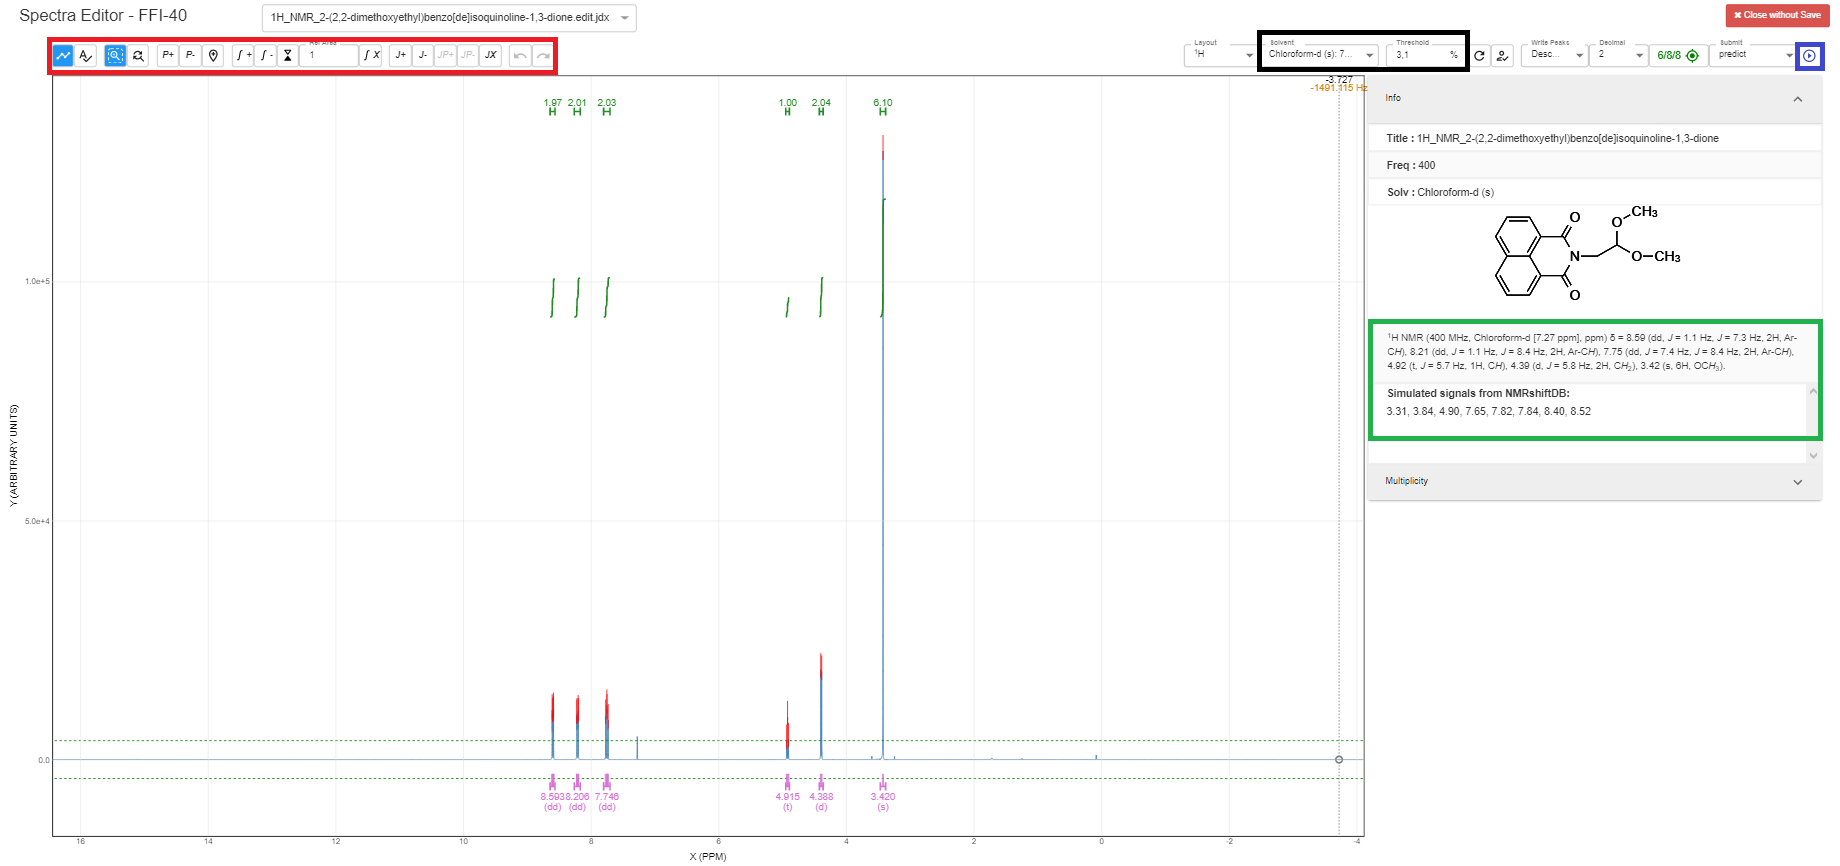
The analysis-tools (peak picking, integration, multiplicity, reference) for the spectra can be accessed through the toolbar in the upper left corner of the user interface (red box). ChemSpectra can obtain the frequency and used solvent of the NMR experiment from the uploaded data.
Additionally, ChemSpectra will automatically predict the NMR spectra based on the NMRshiftDB (green box) and pick peaks which are above the user defined threshold. The threshold can be defined, and the solvent corrected in the upper right corner (black box). The analysis of the spectra can be submitted to the Chemotion ELN through the blue arrow (blue box) in the upper right corner. After submission, the peak list (green box) is generated automatically and can be further modified by the user.
How to use ChemSpectra
-
Open your Sample details and select the Analyses tab. Then click on the
Add analysisbutton to create a new analysis -
Scroll down and select the
+button to add a new dataset -
Click to upload your files or drag and drop your files
-
Click the
Keep Changesto close the popup view and clickSaveto save your files -
After your files were processed, click on the
Spectra Editorbutton to open the analyses viewer
Example workflow
Displaying multiple spectra in a single editor
ChemSpectra supports the visualization of multiple spectra within a single editor view, as long as the spectra belong to the same analysis.
This feature applies to the following types of spectra:
- HPLC UV-VIS
- NMR
- UV/VIS Spectroscopy
- Size Exclusion Chromatography
- Cyclic Voltammetry
- AIF
When such spectra are grouped within one analysis, ChemSpectra will open all of them simultaneously in a tabbed interface. This allows users to switch between the spectra without leaving the editor.
Using the Multi-Spectra display
Open your Sample details and select the Analyses tab. If an analysis contains more than one supported spectrum, clicking the Spectra Editor button will open all the spectra in a single editor window.
Tabs at the top-right of the ChemSpectra editor allow you to switch between the different spectra. Each spectrum behaves as expected, with the full set of tools available for that specific type.
Limitations
- The feature only works when multiple spectra are part of one single analysis
- Spectra across different analyses will still open in separate ChemSpectra windows