Creating a statistical model
Overview
A formula describes how the columns of your dataset are mapped in the statistical model. For example, the table shows three columns: CO2 Uptake, Fertilization, and Water Stress. Here, the CO2 Uptake would be the response variable, i.e., the left side of your model. The variables Fertilization and Water Stress would be the predictors, i.e., the right side of the model. The idea is to see how the predictors affect the response variable. The aim is to see how CO2 Uptake depends on sufficient Fertilization and Water Stress.
| CO2 Uptake | Fertilization | Water Stress |
|---|---|---|
| 0.01 | 0.5 | yes |
| 0.01 | 0.5 | yes |
| 0.6 | 0.5 | no |
| 0.6 | 0.5 | no |
| 0.3 | 10 | yes |
| 0.2 | 10 | yes |
| 0.01 | 10 | no |
| 0.01 | 10 | no |
Getting Started
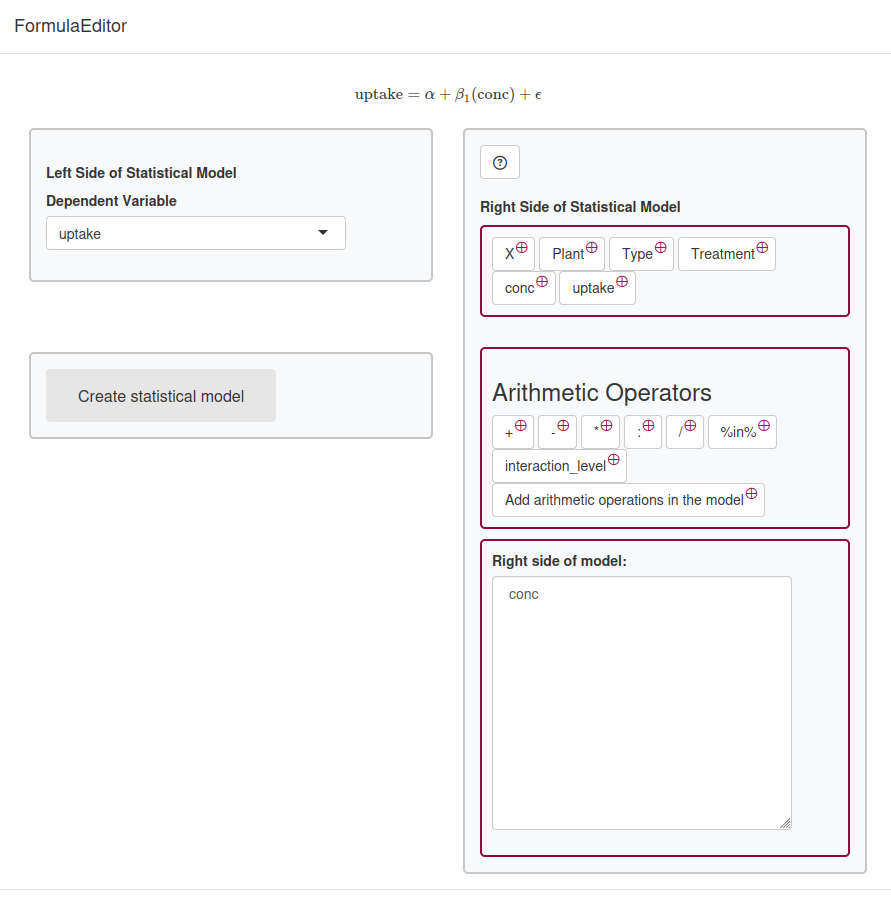
To create your statistical model:
- Select a variable from the dropdown for the left side of your model.
- Choose predictor variables from the right side using the buttons provided.
- Add any necessary arithmetic operations using the operator buttons.
- Click the Create Statistical Model button to build your model.
Here is an example of a simple model:

Left Side of the Statistical Model
This section allows you to define the left side of your statistical model, which typically represents the dependent variable (the outcome you want to predict).
Features
- Variable Selection: Use the dropdown menu to choose a variable for your model.
- Create Model Button: Click this button to build the statistical model once you have selected your variables.
Right Side of the Statistical Model
The right side represents the independent variables (predictors) that explain the outcome.
Features
- Variable buttons: Displays the selected predictor variables for your model.
- Arithmetic Operators: Use the provided buttons to include mathematical operations between variables. Each operator button serves a specific purpose:
- Add (+): Include an additional predictor variable.
- Subtract (-): Remove a predictor variable from the model.
- Multiply (*): Assess interactions between variables.
- Colon (:): Include interactions between two variables.
- Divide (/): Include nested effects that consider both variable levels.
- Nested (%in%): Include nested effects without including the main level.
- Interaction Level: Specify the interaction level in the model.
- Add Arithmetic Operations (I()): Perform normal arithmetic operations within the
I()function.
- Editable Code Area: A text area where you can manually edit the right side of the model if needed. This is useful for users who want to refine their formulas directly.
Basic Formula with ~
Formula:
weight = α + β₁(height) + ε
| height | weight |
|---|---|
| 150 | 50.71908 |
| 160 | 60.07763 |
| 170 | 70.42381 |
| 180 | 80.13322 |
| 190 | 90.86159 |
Formula:
weight ~ height
| term | estimate | std.error | statistic | p.value |
|---|---|---|---|---|
| (Intercept) | -100.135956 | 2.1344248 | -46.91473 | 2.13e-05 |
| height | 1.003406 | 0.0125122 | 80.19408 | 4.30e-06 |
| term | ßs | Standard error of ßs | t-statistic = ßs / Standard error of ßs | p.value |
|---|---|---|---|---|
| Baseline weight (predicted weight if size = 0) | -98.6001595 | 1.1248337 | -87.65755 | 3.3e-06 |
| Effect of height on weight | 0.9944479 | 0.0065939 | 150.81351 | 6.0e-07 |
Adding Multiple Predictors with +
Formula:
price = α + β₁(size) + β₂(bedrooms) + ε
| price | size | bedrooms |
|---|---|---|
| 200.1808 | 1000 | 2 |
| 250.5359 | 1500 | 3 |
| 300.0354 | 2000 | 3 |
| 350.9145 | 2500 | 4 |
| 400.1657 | 3000 | 4 |
Formula:
price ~ size + bedrooms
| term | estimate | std.error | statistic | p.value |
|---|---|---|---|---|
| (Intercept) | 98.7921656 | 0.4884948 | 202.237890 | 0.0000244 |
| size | 0.0988738 | 0.0003674 | 269.119270 | 0.0000138 |
| bedrooms | 1.1958461 | 0.3471582 | 3.444672 | 0.0749271 |
| term | ßs | Standard error of ßs | t-statistic = ßs / Standard error of ßs | p.value |
|---|---|---|---|---|
| Baseline price (for size = 0, bedrooms = 0) | 98.7921656 | 0.4884948 | 202.237890 | 0.0000244 |
| Effect of size on price | 0.0988738 | 0.0003674 | 269.119270 | 0.0000138 |
| Effect of bedrooms on price | 1.1958461 | 0.3471582 | 3.444672 | 0.0749271 |
- Add size and bedrooms as main effects
- A main effect means that the factor is modeled independently from other factors.
Model with Main Effects and Interaction Using *
Formula:
yield = α + β₁(fertilizer_Low) + β₂(water_Low) + β₃(fertilizer_Low x water_Low) + ε
| yield | fertilizer | water |
|---|---|---|
| 80 | High | High |
| 55 | High | Low |
| 77 | High | High |
| 56 | High | Low |
| 35 | Low | High |
| 40 | Low | Low |
| 48 | Low | High |
| 53 | Low | Low |
Formula:
yield ~ fertilizer * water
| term | estimate | std.error | statistic | p.value |
|---|---|---|---|---|
| (Intercept) | 78.5 | 4.663690 | 16.832167 | 0.0000730 |
| fertilizerLow | -37.0 | 6.595453 | -5.609926 | 0.0049602 |
| waterLow | -20.0 | 6.595453 | -3.027830 | 0.0054674 |