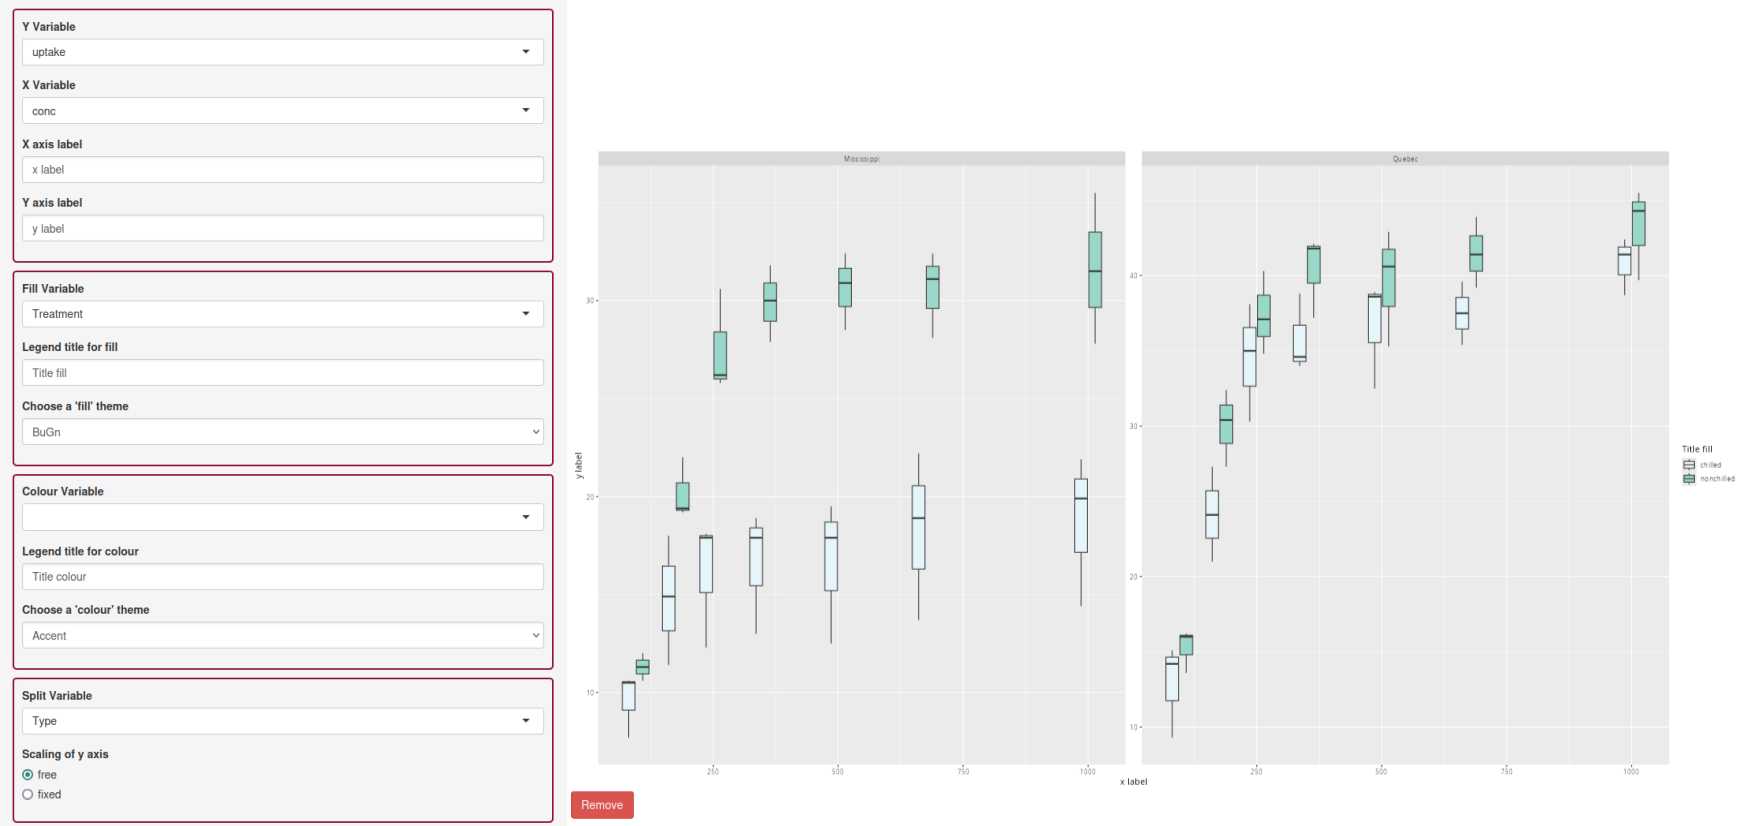
Visualization
For Visualization the subsequent steps are available. Moreover, an example image is provided at the end.
Variable Selection
Select variables for both the x-axis and y-axis:
- Y Variable: Set the variable for the y-axis.
- X Variable: Set the variable for the x-axis, with options to treat it as a factor or numeric. (See plot a)
Conditional Options
Customize your plot with the following settings:
- Choose columns of the dataset which are used to further distinguish the data.
- For box plots, groups can be defined for the color of the box border and the fill of the box (See plot b and c).
- Other plot types only support the color attribute (See plot c).
- Legend Titles: Set titles for fill and color legends to improve legibility.
Axis and Facet Controls
Adjust axis labels, ranges, and facet options:
- Axis Labels: Set custom labels for x and y axes.
- Axis Ranges: Define minimum and maximum values for zooming in on data.
- Split Plot by a Column: Specify a variable to create several subplots (See plot d).
Plot Type Selection and Plot Creation
Choose between Box plot, Scatter plot, and Line plot, and click Create Plot to generate:
- Use interactive adjustments for dimensions and resolution before saving or exporting plots.
